

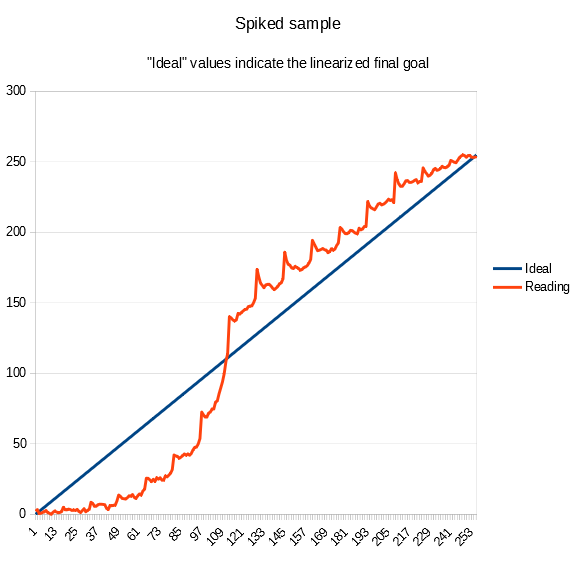
What are spikes?
Spikes are sudden bumps in values, reading a step tablet test print used to calibrate a printing process. Spikes are detectable when they occur between the end of one row and the beginning of the next in a 101 or 256 step tablet. Spikes are wrong discontinuities that shouldn’t happen. Step tablets can be of many formats and with different numbers of steps; different step tablets are affected differently by the spikes issue depending on their format.
What problem do they cause?
Spikes change the real values in the test print of step tablets, and so is the correction curve needed to calibrate a process. If spikes are not very strong it is quite simple to smooth their values out, either using an automated software like the Easy Digital Negatives (EDN) tool or manually if you know what you are doing. When you have high and wide spikes you need some experience to manually smooth their effect out correctly, and if part of their effect remains, even in automated tools, the correction curve to perfectly linearize your process will be affected.
What is causing spikes?
- The main cause I discovered is water flow during development/wash.
- A secondary cause mainly affecting cyanotypes is peptisation.
The water or any other liquid that flows over a test print, inside a development tray, doesn’t move (flow) all at the same speed. There are variables such as tray dimensions, quantity of liquid used etc. that affect the flow more or less and therefore the spikes issue.
When you manually rock the tray, the water on the sides of the print moves at a different speed (compared to the center) because it finds the resistance of the paper. This type of altered flow creates a pattern where the sides of your test print will be washed a bit more than the center, especially because your developing/washing goes on for 15 or 20 minutes. If the sides of your test print are more washed off, there you have spikes indicating density values higher than expected.
Peptisation in cyanotype is an effect of chemical loss from an area. To avoid it, you need a black border around the step tablet (and avoid black texts around), and your sheet of sensitized paper has to remain within the black border during exposure.
“A phenomenon called the ‘edge etch effect’ was conspicuous on some peptisation step tests and requires explanation. This was the loss of image substance from the edges of a step, where it is adjacent to the surrounding regions of maximum density. That the effect is attributable to the adjacent area of high density was demonstrated by printing the step tablet up against the boundary of the sensitized area, in which case there was no loss. The ‘edge etch effect’ is invisible immediately after the print-out exposure; it only appears during the wet-processing. Nevertheless, it can be shown not to be due to migration of ions through the solution during the wet processing; because the effect still occurs even when the entire adjacent high-density region is cut off after exposure but before the wet processing. Evidently the loss is due to ions which have migrated through the paper from the adjacent area during the exposure.”
Mike Ware, Cyanomicon.
How can you avoid spikes?
As I specified earlier, the format of the step tablet is important.
The most affected step tablets are the “classic format” in square with 101 or 256 steps and the linear 21-step tablets.
To avoid the spikes you need to use special randomized step tablets with redundant values, like those used in the PiezoDN calibration system, or the new anti-spike 256 step tablet available inside the video course Digital Negative for Alternative Photography.
How are “classic formats” of step tablets affected by spikes?
A “classic format” of step tablet is normally a strip or a square composed of many different density patches.
As described above, a classic step tablet test print will most probably be affected by how you normally process it in the wet stage (development/wash). The square format of 101 or 256 step tablets is usually printed on a sheet of paper a bit larger than the step tablet size (normally 1 to 2 cm, or ½ inch around) and so, is affected by the water flow issue mentioned previously.
This is also true for the 21 step tablets made on a single row. The only difference with the square step tablets is that, in a single row step tablet, it is not possible to check the effect of the spikes by comparing the values with nearby cells, since you there aren’t any at its sides, but the reading of that step tablet might still lead to an incorrect correction curve when printed on small paper strips.
If we use a much wider sheet of paper and we place the step tablet negative in its center, the wash off effect on the border of the step tablet image is reduced. There remains the peptization effect if you print in cyanotype and you don’t use a wide black border around the step tablet.
How do some special step tablets work with no spikes problem?
PiezoDN and BTNS calibration systems, for example, use special step tablets composed of several steps of identical density, each one of them positioned randomly inside the tablet area, so that reading each one of those steps gives you the ability to average their values. In case one step of a specific density is affected by the spike (because of being washed off for its position), its value can easily be smoothed out by the values of the other identical steps inside the tablet.
Inside the video course Digital Negative for Alternative Photography you will find the new anti-spikes 256-step tablet that lets you print and develop in your usual way without worrying about spikes. It uses a larger array of steps to extend the printed area, in order to limit the bad effect of water flow, it has no labelling texts around it, but has a nice black border to avoid peptisation; it is also compliant with the required Easy Digital Negatives (EDN) calibration system format.
Would you like to contribute to this article?
Adopting a scientific method, doing all the tests that rule out the variables you may think of, and/or that I have already tested, and by consistently following the way you print your process, you may be able to discover a new variable and contribute new data on the spikes issue.
APPENDIX A – False causes I ruled out
I spent a long time analysing and testing, until I reached an understanding of the spikes issue, ruling out many popularly believed causes that are generally not a problem (except in very specific cases).
Printer
Using my Epson P600, I printed a step tablet negative in its normal upright position and then I printed it again rotated at 90 degrees on the same transparency film. If the cause was the printer printing denser at the edge where the print started (an explanation I was given, possibly for certain printers) I should have had no spikes at the beginning of the rows in the test print using the rotated negative, which in fact I still had. I performed the printer quality test, available on the EDN website, and the max error of my printer was detected as 0,7%, while my spikes were huge. Using a scientific approach, and measuring negatives with a transparency densitometer, John Isner (creator of the BTNS calibration system) has proved that the printers he used had no systematic error based on print location.
Coating inconsistencies
To determine if the cause was the coating (the rod leaving more emulsion on the edges or in other areas as stripes), I first positioned the digital negative parallel to the coating direction during exposure, and then rotated 90 degrees, doing different test prints. Coating was not the cause of the issue. Also, the EDN coating quality test always gave me the result “excellent” when using the rod.
Paper curling
To determine if the cause was the paper curling (letting the emulsion “slide” to the edge or having other absorption changes), I taped the paper down all around in many tests and also temporarily glued the paper entirely flat down before coating, letting it dry that way. Curling was not the cause of the issue.
Exposure
To determine if the cause was due to uneven exposure of my UV exposure unit, I measured via a Dose Meter that there was uniformity, and also made test prints rotating the digital negative 90 degrees under the exposure unit made with fluorescent tubes to prevent any banding, but I still had spikes at the beginning of the rows.
Relative Humidity
To determine if the cause was Relative Humidity (affecting paper absorption), I tested the paper under varying R.H. conditions and I always got the spikes. I tend to work in a controlled environment with a 70% RH average, using a dehumidifier when needed.
Drying after exposure
To determine if the cause of spikes was because of color drift while drying the developed paper, hanging it vertically, so that there could be a shift of densities on the print edges, I tried drying the developed test prints horizontally, but the spikes were exactly the same.
Fluid dynamics
I initially thought I ruled this variable out, but in a too simplistic way. This tells how easy it might be to test in the wrong way. Read more in Appendix B if you are interested to discover how I tested it.
APPENDIX B – Tests
In my calibration process and for the spikes tests I used Arches Platine, coated with a rod. By the time I made the last fifth or sixth pass, my emulsion was almost totally absorbed and the paper was just slightly shiny, as it should be.
To read the values of my test prints I used a scanner and the free tool available at the Easy Digital Negatives website. I also double checked the values by doing a manual reading. Peter Mrhar explained to me that the raw result coming out of his EDN tool is nothing but the value of the color in each square of the step tablet test print. The program does not affect these values in any way; it just reads them one by one. The data in the raw graph are therefore unchanged color data read before the correction curve is created. You will find a few of the EDN raw graphs further on.
About water dynamics in the wet process. Latest conclusive tests
While developing my cyanotypes I had noticed that the water inside a tray flows faster on the edges and slower at the center of the test print. In other words, the water washes more at the edges creating lighter prints at the edges due to wash off of exposed emulsion.
I decided to reprint my worst case test print of a 256 step tablet negative, but using a very different way of developing and washing.
I rolled my new test print inside a cylinder so that the full print was facing inwards. I rolled the print so that the sides, where spikes show up, were longitudinal to the cylinder and in doing so, both sides and center of the test print would be washed uniformly.
I filled a deep and wide bucket full of water and I held the cylinder with the print well inside the water.
I moved the cylinder constantly back and forth for 20 minutes, so that the washing water would flow inside it over the print and I would avoid any staining. The result was a well cleared test print with barely any spikes.
Below you can see a comparison of the values read from the two test prints, old and new.
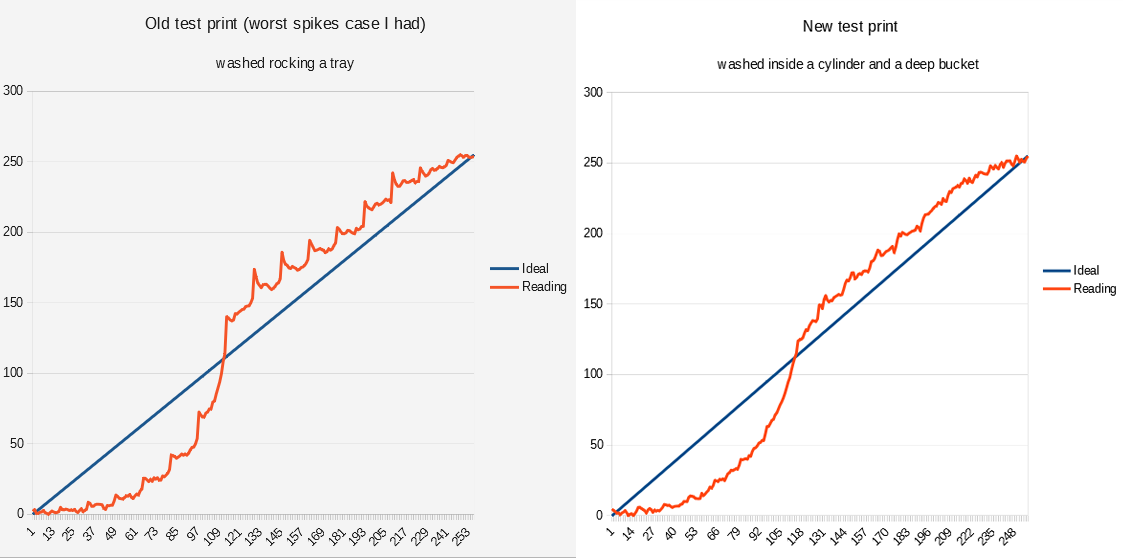
and on the right, a new test print made using the same negative shows almost no spikes.
When I decided to start investigating spikes
Quite a while ago, I had to linearize a new batch of paper and so I made three new test prints, to average their values. I used the same step tablet negative to make the prints and all of them had evident spikes as you can see below.

called NEG23.
I then wanted to determine what caused the spikes and I printed again the same step tablet negative together with the EDN coating quality negative. See the two graphs below.

Surprisingly, the new test print of the step tablet negative showed very little spikes compared to its three siblings, while the EDN coating quality test showed some spikes at the beginning of the rows.
I was puzzled and couldn’t understand the reason for those differences, but after some time of investigation and looking closely again at the newer step tablet test print I could see that its development/wash had been made much slower than normal because the print had a stain in the white areas (which you don’t want!), while the coating quality test showing spikes had been washed properly (doing more rocking) and had no stain. This was the major clue for better investigating the water flow.
Twin prints with a different behavior
To reduce variability and to average possible inconsistencies due to darkroom variables when test printing the step tablet to linearize my process, I printed two identical step tablet negatives, one beside the other, on the same transparency film.
That way I could coat, print and develop a single sheet of paper containing two step tablets, that I thought should be more or less identical. The interesting result was that the spikes, reading the values of the two test prints, were quite different.
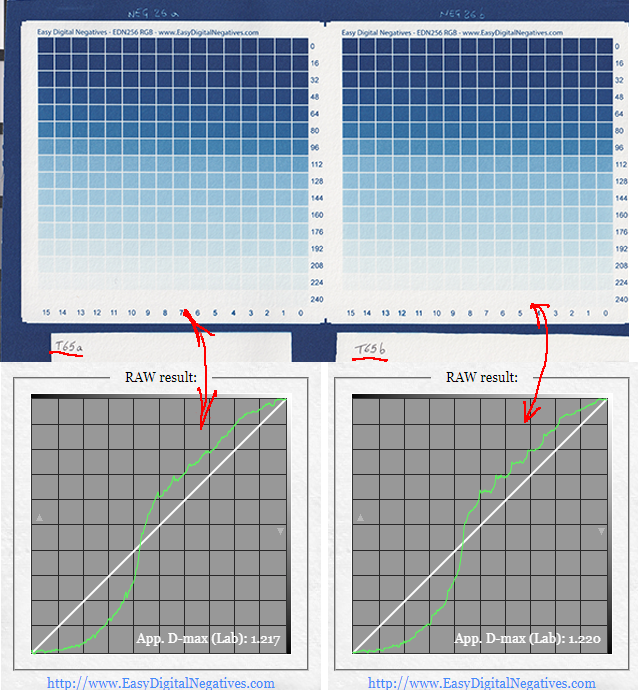
The different shape of the spikes was evident, although, for the information I had, I thought they should have been identical.
I started guessing here that the water flow could be playing a role, but a slight unevenness and/or other variables could also be a cause. I did many other tests, eventually ruling out all the other variables.
The differences between having spikes and not in your calibration process
It is important to get rid of the spikes. The spikes affect how faithful and precise your linearization will be. So either you know what you are doing and smooth them out while making your correction curve, or you use automation software to do it for you.
The EDN-free tool is engineered in a way that detects the spikes and smooths them to remove local irregularities while making the correction curve for you. Spikes, even sharp ones, are almost always a single isolated raw value that will be removed by smoothing. But if the spikes are wider, smoothing will not eliminate the issue completely and they will influence the correction curve.
In the example below you can see the raw values (purple color curve) of a test print I did using my new anti-spikes 256 step tablet. From those raw values, EDN creates a perfect correction curve (green color) that is specular (a mirror image) of the raw values, as it should be.
The correction curve generated from an almost spikeless test print is faithful and precisely represents the need to perfectly linearize your negative.
If you manually create your own correction curves, low spikes will give you little doubts on how to smooth them out.
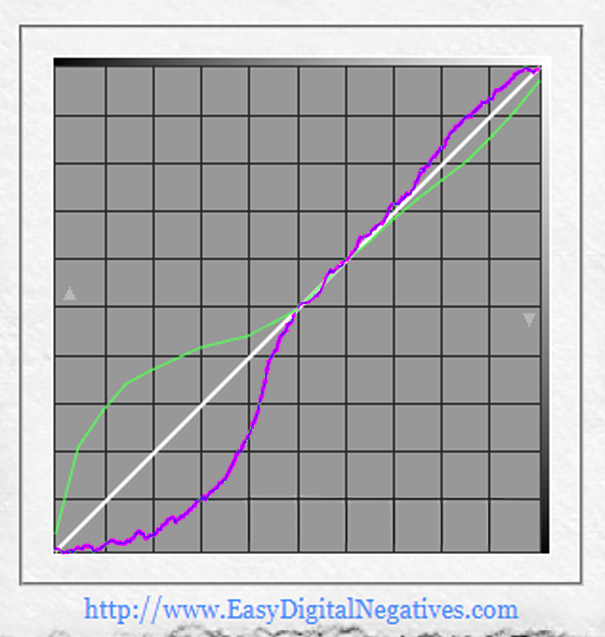
In the example below you can see the raw values (purple) of a spiked test print and the correction curve (green) created by EDN.
EDN is able to take into consideration the existence of spikes when reading the raw values of your test print, compensate for them and so create a good correction curve.
Nonetheless, above a certain level spikes start making part of the equation when EDN creates the correction curve.
If you manually create your own correction curves, you need to know what you are doing and how to level those spikes out without interfering with good density values coming from your test print.
In the graph below I drew a yellow line above the diagonal to visually represent the raw values curve (purple color) if no spikes were present. I drew a specular yellow line (mirror image) below the diagonal, representing the correction curve needed in case no spikes were there. An area filled in yellow shows the gap from perfect linearization, in case no spikes were generated, to approximation of the correction curve due to the presence of spikes.

Spikes are not a representation of a perfect test print but an external issue due to how the step tablet is made and the test print developed/washed. Removing the spikes is important, in order to work with better data and get more precise correction curves for the best linearization of our photographs.
APPENDIX C – Water flow examples
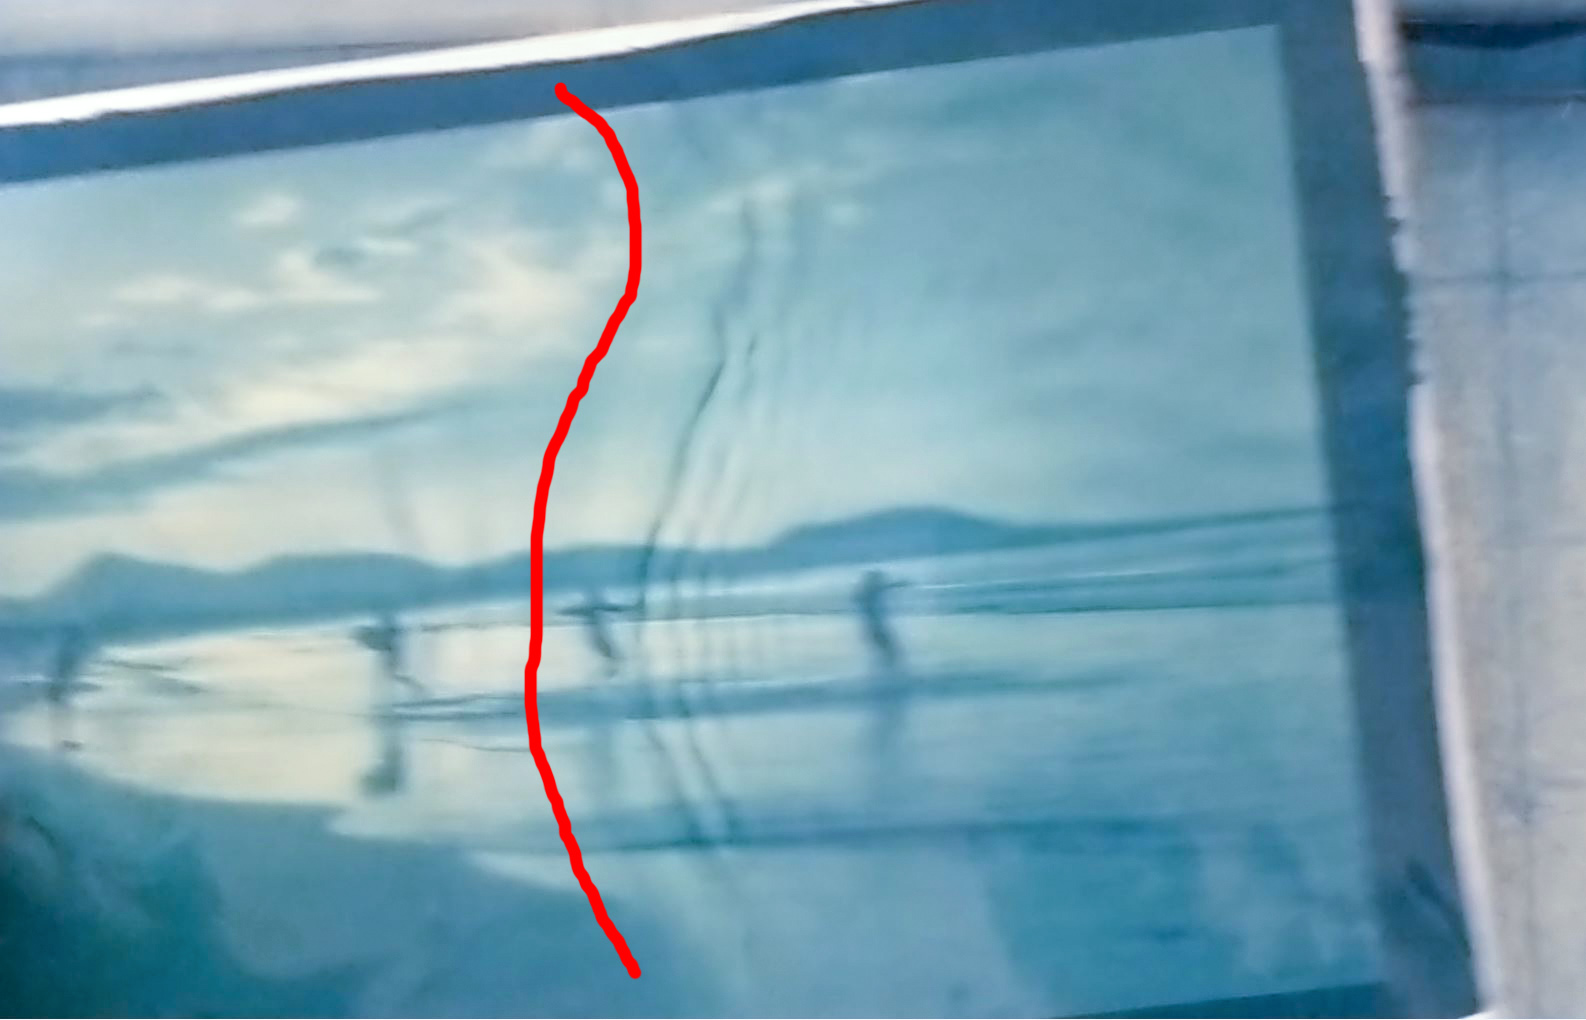
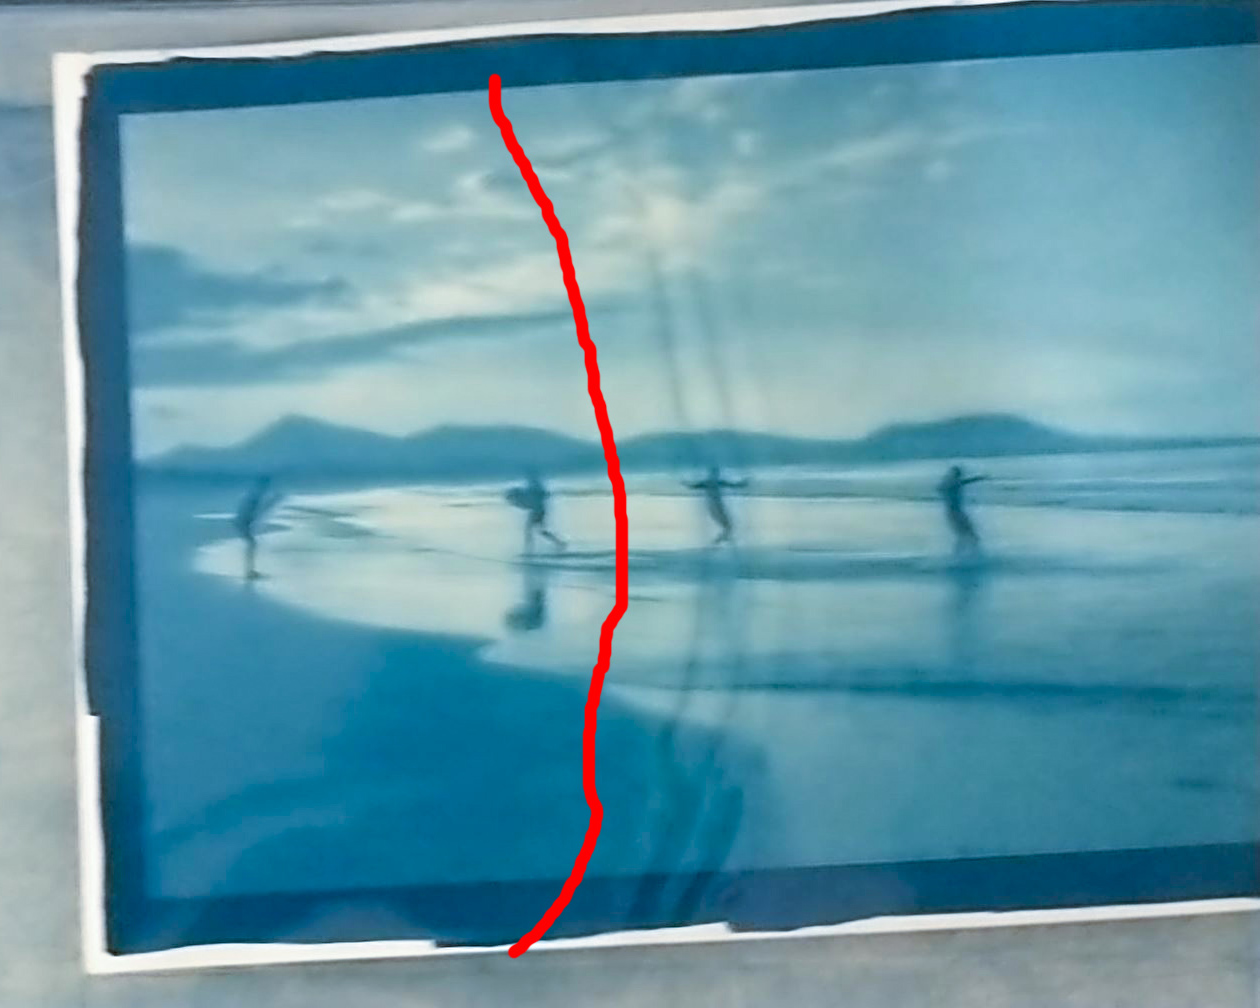
Below I show a couple images taken with my cell phone while developing a real print, inside a wider tray compared to the one I normally use when developing the smaller test prints of the step tablet.
As you can see the flow is not uniform over the print.
Different factors such as tray dimensions, quantity of water, dimensions ratio between print and tray, rocking, etc. differently affect the water flow.
This is an external resource of the video course Digital Negative for Alternative Photography. You can read more about it in this website clicking HERE.